Within AI Power Demand
Why Cooling AI Data Centres Takes So Much Power
Powerful AI chips generate concentrated heat, making cooling systems and supporting equipment increasingly important to data centre electricity use.
Published
On this page
- Why increasingly powerful AI server racks create difficult cooling demands
- Air cooling versus liquid cooling: electricity, equipment and water trade offs
- What power usage effectiveness reveals about data centre efficiency
Page outline Jump by section
Updated
Introduction
Liquid cooling is increasingly necessary for the most powerful AI servers, but it is not a complete solution to data centre electricity demand. It can remove concentrated heat more effectively than conventional air cooling, reduce some cooling overheads and allow more computing equipment to operate in a smaller space. However, it introduces additional equipment, installation costs and maintenance requirements, while the electricity consumed by the AI chips themselves remains substantial.
The most important distinction is between making cooling more efficient and reducing total electricity consumption. A data centre can become more efficient while using more power overall if it installs additional AI servers.
The International Energy Agency (IEA) estimates that cooling accounts for approximately 7% of electricity consumption in efficient hyperscale data centres, but more than 30% in some less-efficient enterprise facilities. That difference shows why cooling design matters, but also why the potential savings depend heavily on the starting point. IEA
For operators, electricity suppliers and local communities, the practical comparison is:
| Cooling approach | Main advantage | Main limitation |
| Conventional air cooling | Established equipment, relatively straightforward maintenance | Increasingly difficult for densely packed, high-power AI racks |
| Direct-to-chip liquid cooling | Removes heat close to powerful processors and supports higher rack densities | Requires liquid distribution equipment, compatible servers and careful maintenance |
| Immersion cooling | Can remove heat from densely packed components using specialised fluids | Requires substantial changes to equipment, servicing and infrastructure |
| Evaporative cooling | Can reduce electricity needed for mechanical refrigeration | Consumes water, sometimes in areas already experiencing water stress |
| Dry or closed-loop heat rejection | Can substantially reduce direct water consumption | May increase electricity demand, especially during hot weather |
These technologies are not always alternatives. A facility may use liquid cooling inside server racks, air cooling for other equipment and evaporative or dry cooling to release heat outdoors.
The central question is therefore not simply which cooling technology uses the least electricity. It is which combination delivers reliable computing capacity at an acceptable total cost in electricity, water, equipment and local infrastructure.
Why powerful AI racks are harder to cool
AI chips turn most of the electricity they consume into heat. That heat must be removed continuously to prevent processors from overheating, slowing down or shutting down.
Conventional servers already generate significant heat, but modern AI systems concentrate much more computing power into individual racks. A rack is a cabinet containing multiple servers, network connections and supporting equipment.
The problem is not merely that an AI data centre generates more heat overall. It is that increasingly large quantities of heat are produced within a relatively small physical area.
Heat density changes the engineering problem
Traditional data centre cooling relies heavily on moving cold air through server rooms. Fans push air across hot components, while air-conditioning equipment removes the heat.
This approach becomes harder as rack power increases. More electricity flowing through a rack means more heat must be transferred away from its components. At sufficiently high densities, the required airflow becomes difficult to deliver efficiently.
NVIDIA’s GB200 NVL72 illustrates the change. The system combines 72 graphics processing units (GPUs) and 36 central processing units (CPUs) in a tightly integrated, liquid-cooled architecture. It is designed to operate as a connected computing system rather than as a collection of relatively independent servers. NVIDIA
This arrangement helps AI processors exchange information rapidly, but also concentrates their electricity demand and heat output.
The engineering consequences extend beyond the chips:
- Airflow: Moving enough air through densely packed equipment can require larger fans, greater pressure and redesigned airflow paths.
- Cooling capacity: The facility must remove heat continuously, including during periods of maximum AI workload.
- Power distribution: Electrical equipment must support high rack loads, while power conversion losses generate additional heat.
- Reliability: Cooling failures can affect expensive computing equipment and interrupt AI services.
- Building design: Rack layout, pipework, floor loading and available space increasingly influence which AI systems a facility can accommodate.
Research published by Lawrence Berkeley National Laboratory in 2026 highlights the importance of this shift towards high-power-density infrastructure. It also notes that improved liquid cooling can increase the temperature at which waste heat is collected, potentially making that heat more useful elsewhere. Energy Analysis Division
Why more efficient chips do not eliminate heat
A more efficient AI processor can perform more calculations for each unit of electricity consumed. That is a genuine improvement, particularly when comparing the energy required to complete a specific task.
However, efficiency per calculation and total power consumption are different measurements.
If newer processors deliver substantially more computing capacity, operators may install larger clusters or run more demanding workloads. Electricity demand can consequently increase even when the energy required for individual calculations decreases.
Cooling equipment must handle the electricity actually consumed, not the theoretical efficiency of the processors.
For example, a cluster drawing 10 megawatts (MW) of computing power will produce roughly 10 MW of heat from that equipment, regardless of how many AI calculations it completes. A more efficient chip only reduces the heat burden if it reduces electricity consumption for the workload being delivered.
This is one reason improvements in chip efficiency cannot automatically be translated into equivalent reductions in data centre electricity demand.
Air cooling versus liquid cooling
The most important difference between air and liquid cooling is how effectively they transfer heat away from electronic components.
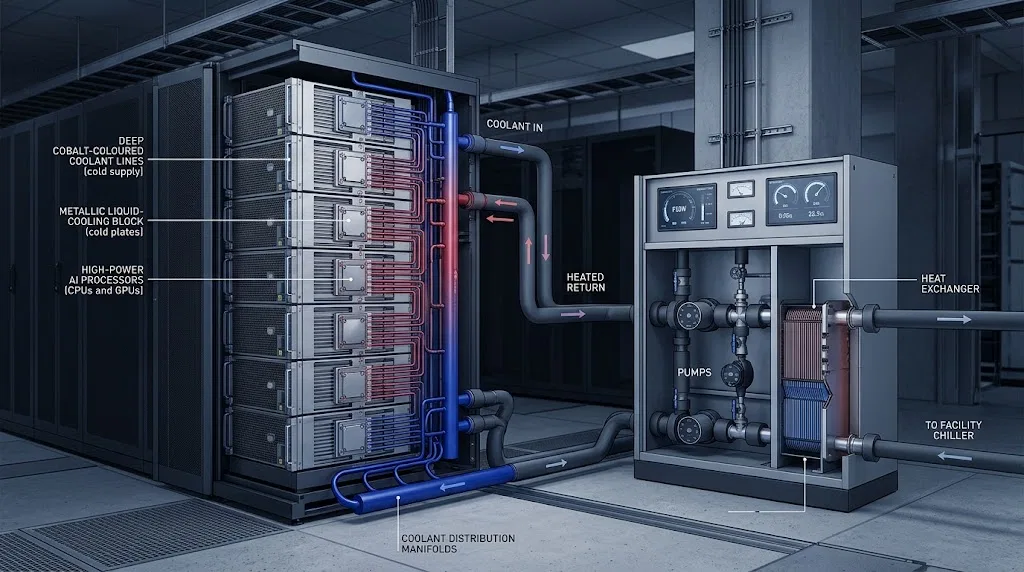
Air cooling moves large volumes of air across equipment. Liquid cooling uses a circulating fluid to collect heat more directly, taking advantage of liquids’much greater capacity to carry heat.
For high-density AI systems, liquid cooling can therefore provide a practical route to operating hardware that would otherwise be difficult or expensive to cool using air alone.

Direct-to-chip cooling
Direct-to-chip cooling circulates liquid through specially designed metal plates attached to processors and other high-heat components.
Heat passes from the chip into the plate and then into the circulating liquid. The warmed liquid travels to a cooling distribution unit, which transfers heat into another cooling circuit.
The fluid generally remains separated from the electronics.
This design can reduce reliance on high-volume airflow and allow the facility to operate with warmer cooling water than would be practical in some conventional air-cooled systems.
Warmer cooling water matters because it can reduce the need for energy-intensive refrigeration. Under suitable outdoor conditions, a facility may be able to reject heat without operating conventional chillers as heavily.
However, direct-to-chip cooling rarely removes every source of heat inside a server. Memory, power supplies, networking components and other equipment may still need air cooling.
Consequently, many AI facilities use hybrid systems combining liquid-cooled processors with conventional air-cooled components.
Immersion cooling
Immersion cooling takes a different approach. Electronic components are placed in a specialised electrically insulating liquid that absorbs their heat.
Some systems circulate the liquid through heat exchangers. Others use fluids that boil at relatively low temperatures and condense again within a controlled system.
Immersion cooling can support high equipment densities and reduce the need for conventional server fans.
However, it also changes how servers are designed, installed, repaired and replaced. Operators must consider fluid compatibility, handling procedures, servicing arrangements, equipment warranties and the long-term availability of specialist components.
The relevant comparison is therefore not simply the amount of electricity saved by removing fans. It is the full cost of operating a different cooling and maintenance system over the equipment’s lifetime.
Why liquid cooling is not automatically cheaper
Liquid cooling can reduce some operating costs, but it requires investment in additional infrastructure.
Typical components include cooling plates or immersion tanks, pumps, liquid distribution systems, heat exchangers, monitoring equipment, leak detection and connections to the facility’s wider cooling system.
Retrofitting an existing data centre may also require changes to server racks, pipework, electrical systems and building layout.
These costs can be justified where high rack densities allow operators to deploy computing equipment that conventional cooling cannot reliably support. They may be harder to justify for lower-density workloads already served efficiently by existing systems.
The US Department of Energy’s Lawrence Berkeley National Laboratory models data centre cooling using several facility and cooling configurations. Its 2024 report finds that efficiency varies with climate, equipment type and operating practices, rather than cooling technology alone. It also warns that real installations do not always achieve their designed performance. LBL ETA Publications
For a new AI facility, liquid cooling may be part of the most economical design. For an older data centre, the best investment may instead be improved airflow management, more efficient cooling controls or selective upgrades.
Cooling water versus cooling electricity
One of the most consequential decisions in data centre design is how the facility releases heat into the surrounding environment.
Removing heat from AI chips is only the first stage. That heat must eventually be transferred outdoors, into a water system or to another useful destination.
This is where the trade-off between electricity consumption and water use becomes particularly important.
Evaporative cooling saves energy but consumes water
Evaporative cooling uses the fact that water absorbs heat as it evaporates.
In a cooling tower, warm water transfers heat to the atmosphere, partly through evaporation. This can reduce the need for mechanical refrigeration and therefore lower electricity consumption.
The disadvantage is that evaporated water must be replaced. Additional water may also be discharged to prevent dissolved minerals from accumulating inside the cooling system.
A 2022 study published in Resources, Conservation and Recycling compared two data centres in the Phoenix area of Arizona. One used air-cooled chillers, while the other combined water-cooled chillers with evaporative cooling.
The researchers found that the air-cooled facility had an average power usage effectiveness approximately 13% higher than the water-cooled facility. However, its water consumption associated with both the facility and electricity supply, measured using the study’s source-water metric, was 66% lower. ScienceDirect
This illustrates an important point: the cooling system that uses the least electricity is not necessarily the one with the lowest water footprint.
In regions with plentiful water and relatively expensive electricity, evaporative cooling may offer an attractive balance. In drought-prone areas, the same design can place pressure on water supplies shared with households, agriculture and other industries.
Closed-loop cooling does not necessarily mean zero water use
Closed-loop liquid cooling circulates the same cooling fluid repeatedly. It does not normally require a continuous supply of replacement water inside the server cooling circuit.
However, a closed-loop system can still transfer heat to an evaporative cooling tower elsewhere in the facility.
This distinction is often lost in claims that liquid cooling uses little or no water.
A facility’s water consumption depends on the complete cooling arrangement, especially its final heat-rejection system, rather than simply whether liquid flows through its servers.
Microsoft provides a useful example. In December 2024, the company announced a new data centre design intended to eliminate water evaporation for cooling by combining chip-level liquid cooling with a closed-loop system.
Microsoft estimated that the design could avoid more than 125 million litres of water use annually per data centre compared with its earlier cooling arrangements. However, it also acknowledged that replacing evaporative cooling with mechanical cooling would increase power usage effectiveness, although warmer cooling-water temperatures could limit the electricity penalty. The company identified pilot in Arizona and Wisconsin, with facilities expected to begin operating in late 2027. The Microsoft Cloud Blog
These figures describe Microsoft’s projected design performance, not independently verified operating results from those future facilities.
The example nevertheless makes the engineering trade-off clear. Reducing local water consumption may require accepting somewhat higher electricity use.
Water savings can shift costs elsewhere
Cooling decisions can also change where environmental impacts occur.
A facility using dry cooling may consume very little water directly, but require additional electricity. Depending on the electricity supply, generating that power may consume water at power stations or produce additional carbon emissions.
Research published in 2026 by University College London examines this problem through modelling of data centre cooling within urban energy systems. It finds that evaporative cooling can reduce electricity-related impacts while increasing on-site water consumption, whereas dry cooling can shift some of the burden towards electricity generation. UCL Discovery
A separate 2026 study presented at the ACM International Conference on Future and Sustainable Energy Systems found that the benefits of dry cooling depend on both the electricity penalty and the water stress associated with the supplying electricity grid. DOI
This does not mean dry cooling is environmentally undesirable. It means the outcome depends on local conditions.
For a community considering a new AI data centre, useful questions include how much water the facility will consume during summer, whether it will use drinking water or reclaimed water, and how much additional electricity its cooling equipment will require during hot weather.
These questions can reveal impacts that a single annual efficiency figure conceals.
What power usage effectiveness reveals
Power usage effectiveness, usually abbreviated to PUE, is the most widely used measure of data centre infrastructure efficiency.
It compares the electricity consumed by the entire facility with the electricity used by its computing, storage and networking equipment.
PUE = Total facility electricity IT equipment electricity \text{PUE}=\frac{\text{Total facility electricity}}{\text{IT equipment electricity}} PUE = IT equipment electricity Total facility electricity
A PUE of 1.0 would mean that all the electricity entering the facility is used by IT equipment, with no additional electricity consumed by cooling, power conversion or other supporting systems.
In practice, PUE is greater than 1.0.
The closer it gets to 1.0, the smaller the facility’s supporting electricity overhead.
What different PUE values mean
Consider a data centre whose IT equipment consumes 100 MW continuously.
| PUE | Total facility power | Supporting equipment power | Annual facility electricity |
| 1.60 | 160 MW | 60 MW | 1.402 TWh |
| 1.40 | 140 MW | 40 MW | 1.226 TWh |
| 1.20 | 120 MW | 20 MW | 1.051 TWh |
| 1.10 | 110 MW | 10 MW | 0.964 TWh |
These are illustrative calculations, assuming constant power consumption throughout the year. The supporting equipment figure includes cooling and other non-IT electrical overheads.
Improving PUE from 1.40 to 1.20 would save 20 MW for this example facility, equivalent to approximately 175 million kilowatt-hours annually.
That is a meaningful saving. It could reduce electricity bills, lower the required grid connection capacity and potentially reduce emissions.
However, the same example also demonstrates the limit of efficiency improvements.
Even at PUE 1.10, the facility still requires 110 MW to support 100 MW of computing equipment. The electricity used by the processors remains the dominant requirement.
How efficient are real data centres?
The Uptime Institute Global Data Center Survey 2025 reported a weighted average annual PUE of 1.54 among respondents.
Its survey found that the headline figure had remained largely unchanged for six consecutive years, despite substantial improvements over the longer term. In 2007, the reported average was approximately 2.50. datacenter.uptimeinstitute.com
This suggests that many of the easiest infrastructure improvements have already been implemented, particularly in modern facilities.
Nevertheless, performance varies significantly between data centres.
Google reports that its large-scale data centre fleet achieved an average PUE of 1.09 in 2025. This is a company-reported figure, but its published methodology includes year-round measurement across facilities in stable operation. Google Data Centers
The comparison needs care. Google’s figure covers a particular fleet of large-scale facilities, while the Uptime Institute survey includes a broader range of operators, building ages and facility types. The two figures are not measurements of identical populations.
Even so, they demonstrate that the best-performing large facilities can operate with much lower infrastructure overheads than many older or smaller data centres.
Why a low PUE can be misleading
PUE measures how much electricity supports the IT equipment. It does not measure how efficiently that equipment performs useful work.
A data centre with a PUE of 1.10 could run inefficient processors, poorly utilised servers or unnecessarily demanding workloads.
Another facility with a PUE of 1.30 could potentially complete the same computing tasks using less total electricity if its hardware and software were substantially more efficient.
PUE also excludes several important environmental and economic costs:
- Water consumption associated with cooling.
- Electricity and water used to manufacture chips and cooling equipment.
- Carbon emissions associated with the electricity supply.
- The amount of useful computing work completed.
- The cost of grid connections and supporting infrastructure.
For these reasons, PUE should be treated as a measure of facility overhead, not as a complete sustainability score.
The IEA uses PUE as an important component of its data centre electricity modelling, while distinguishing the electricity consumed by computing equipment from the supporting infrastructure. IEA Blob Storage
Why efficiency improvements are reaching limits
Data centre efficiency has improved substantially over time, but further improvements become harder as the remaining overhead shrinks.
There are three reasons why cooling optimisation alone cannot offset unlimited growth in AI computing demand.
The remaining savings become progressively smaller
Suppose a data centre has a PUE of 1.20.
For every 100 units of electricity consumed by IT equipment, it uses another 20 units for cooling and supporting systems.
Even eliminating that entire overhead would reduce total facility electricity consumption by only about 17%.
In reality, some supporting electricity demand is unavoidable. Pumps, electrical distribution systems, control equipment and other essential infrastructure must continue operating.
As a result, the opportunity to reduce total electricity demand through PUE improvements becomes smaller as facilities approach the theoretical minimum.
This is a mathematical limit rather than a failure of engineering innovation.
AI computing capacity can grow faster than efficiency
Consider an AI data centre that initially operates 50 MW of computing equipment at PUE 1.40.
Its total power demand is 70 MW.
The operator subsequently expands computing capacity to 100 MW while improving PUE to 1.15.
Total demand becomes 115 MW.
Despite a substantial improvement in infrastructure efficiency, the facility’s electricity demand increases by approximately 64%.
This is particularly relevant to AI because operators are investing in larger computing clusters and more demanding inference services.
The IEA’s Energy and AI report identifies accelerated computing equipment as an important driver of data centre electricity demand. Its analysis also shows why improvements in infrastructure efficiency do not automatically translate into falling sector-wide electricity consumption. IEA
Cooling efficiency can therefore slow the growth of electricity demand without reversing it.
Reliability imposes additional constraints
Data centres must remain operational during changing workloads, equipment failures and periods of extreme weather.
Cooling systems therefore require enough capacity to handle demanding conditions, rather than merely the average temperature or average computing workload.
Facilities may need redundant pumps, backup cooling capacity, additional electrical infrastructure and monitoring systems.
These arrangements increase costs and can add to electricity overheads, but they also reduce the risk of service interruptions and equipment damage.
Operating closer to the thermal limits of expensive AI processors may improve efficiency under normal conditions while reducing the margin available during failures.
The cheapest or most electricity-efficient design on paper is not necessarily the most reliable over its operating lifetime.
This helps explain why real-world performance can differ from engineering simulations. Lawrence Berkeley National Laboratory notes that cooling equipment does not always operate as designed, with poor coordination between systems sometimes undermining efficiency. LBL ETA Publications
Who pays for more advanced cooling?
The financial consequences of AI cooling extend beyond the operator’s electricity bill.
Cooling infrastructure affects construction costs, operating expenditure, grid connection requirements and the resources used by surrounding communities.
Data centre operators and cloud customers
The most direct costs fall on companies building and operating AI infrastructure.
Liquid cooling can require specialised hardware, pipework, pumps, heat exchangers and maintenance procedures. It can also create dependencies between server designs and facility infrastructure.
These investments may reduce electricity costs or allow more computing capacity to fit into a given building.
However, the economic return depends on the amount of useful computing work delivered, the cost of electricity and water, equipment utilisation, and the lifetime of the installation.
Where cooling infrastructure is expensive, operators may recover those costs through cloud computing prices and charges for AI services.
The result is that cooling costs can become part of the wider price of training AI models and running inference, even when customers never see cooling as a separate charge.
Electricity networks and other customers
Cooling efficiency also affects the amount of electrical capacity a facility needs from the grid.
For example, a planned data centre with 100 MW of IT equipment would require 140 MW of facility power at PUE 1.40, compared with 115 MW at PUE 1.15.
That 25 MW difference could materially affect the size of its electricity connection and the infrastructure required to supply it.
However, whether those savings reduce costs for other electricity customers depends on local grid arrangements, investment decisions and how network costs are allocated.
A more efficient facility may require less additional capacity than an inefficient one, but its total electricity demand can still be large enough to require major grid upgrades.
Local communities and water providers
Cooling choices can have particularly visible local consequences.
An evaporatively cooled data centre may require substantial water supplies, including during hot periods when demand from households and other users is also high.
A dry-cooled facility may reduce direct water consumption but increase its peak electricity demand.
Both arrangements can require infrastructure investment.
The relevant public question is not whether liquid cooling is inherently good or bad. It is whether the facility’s design accounts for local resource constraints and whether the costs of supporting it are distributed fairly.
Water providers, planning authorities and electricity network operators need sufficiently detailed information to assess those consequences.
Research from Lawrence Berkeley National Laboratory published in 2025 found that water consumption per data centre workload can vary by more than 10,000 times across the conditions examined. Factors include server efficiency, the electricity supply, cooling technology, climate and utilisation. This variation reinforces the need for site-specific assessments rather than generic assumptions about AI cooling. Energy Technologies Area
Can waste heat improve the economics?
Almost all electricity consumed by computing equipment eventually becomes heat. In most data centres, that heat is released into the surrounding environment.
An alternative is to capture some of it for useful purposes, such as heating buildings or supplying a district heating network.
Liquid cooling can make this more practical because it can collect heat at higher temperatures than conventional air-cooling arrangements.
Higher-temperature waste heat is generally easier to reuse because less additional heating is needed to make it suitable for other applications.
Lawrence Berkeley National Laboratory researchers have identified this as an opportunity for AI infrastructure. Their 2026 analysis discusses how advanced cooling systems can raise recoverable heat temperatures from around 30°C in typical air-cooled arrangements to above 50°C in some liquid-cooled systems. Energy Analysis Division
However, heat reuse has important limitations.
The data centre must be close enough to a suitable heat customer, and the heat must be available at a useful temperature and time.
Demand for building heating also varies seasonally, while AI servers may operate throughout the year.
Connecting a data centre to a district heating system requires additional equipment, pipework, commercial agreements and potentially heat pumps.
Recovering heat does not eliminate the electricity consumed by AI processors. It may instead reduce the energy another customer would otherwise need for heating.
The strongest opportunities are therefore likely to arise where data centres are planned alongside existing or proposed heat networks, rather than where heat reuse is added as an afterthought.
What should determine the cooling choice?
There is no universally optimal cooling technology for every AI data centre.
The best choice depends on the density of computing equipment, local climate, electricity prices, water availability, reliability requirements and the cost of installing and maintaining the system.
For high-density AI clusters, direct-to-chip liquid cooling is increasingly an enabling technology rather than simply an efficiency upgrade. It allows operators to remove concentrated heat and deploy computing configurations that conventional air cooling may struggle to support.
For lower-density equipment, improving existing air cooling can remain more economical.
For facilities in water-stressed regions, avoiding evaporative water consumption may be worth accepting additional electricity demand, particularly where electricity comes from relatively low-carbon, low-water-use sources.
For facilities in cooler climates, opportunities to reject heat using outdoor conditions can reduce the need for mechanical refrigeration.
These choices should be assessed using several measurements together:
| Measurement | What it answers | What it misses |
| Power usage effectiveness (PUE) | How much electricity is consumed beyond the IT equipment? | Computing efficiency, water use and carbon intensity |
| Water usage effectiveness (WUE) | How much on-site water is consumed relative to IT electricity? | Water used to generate electricity and local water stress |
| Total electricity consumption | How much power and energy does the facility actually require? | Whether computing work is performed efficiently |
| Peak electrical demand | How much grid capacity is needed during demanding conditions? | Total annual electricity consumption |
| Total cost of ownership | What does the cooling system cost to build, operate and maintain? | Environmental costs not included in financial accounts |
A robust assessment should also compare the amount of useful AI computing work delivered, rather than treating the number of installed processors as the final measure of productivity.
The 2025 research on cooling systems in hot, dry climates and the 2026 analysis of water-energy-carbon trade-offs both support this broader approach. They demonstrate that the preferred cooling arrangement can change when water use, electricity consumption and local conditions are considered together. ScienceDirect
The broader lesson for AI data centre electricity demand is that cooling efficiency matters, but it cannot remove the physical cost of computation.
Better cooling can lower overheads, make powerful AI equipment viable, reduce certain resource pressures and improve the economics of individual facilities. Yet the heat generated by computing equipment still has to go somewhere, and rising computing capacity can outweigh the savings.
The most meaningful measure of progress is therefore not simply a lower PUE or the adoption of liquid cooling. It is whether an AI data centre can deliver more useful computing work while reducing its total electricity demand, water burden and infrastructure costs relative to the alternatives.
Amazon book picks
Further Reading
Books and field guides related to Why Cooling AI Data Centres Takes So Much Power. Use these as the next step if you want deeper reading beyond the article.
The Ultimate Beginner’s Guide to AI Data Centers
Are you prepared for the massive infrastructure shift required to power the AI revolution? In The Ultimate Beginner’s Guide to AI Data...
AI Data Center Infrastructure Engineering
Discover the first comprehensive engineering handbook dedicated to the physical architecture of AI data centers. As GPU clusters demand...
AI Data Center Technician
The build-out is outrunning the people who can run it. AI racks draw 120–130 kW. Air cooling stopped working at 20. What replaced it...

Thermal guidelines for data processing environments
First published 2012. Subjects: Electronic data processing departments, Buildings, Heating and ventilation, Cooling, Design and...
eBay marketplace picks
Marketplace Samples
Live-tested eBay searches with available results related to this page.
Selected fromartificial intelligence poster oneBay.co.uk.

Current eBay listing
METAL POSTER A.I. Artificial Intelligence SIGN PLAQUE Film Movie A6 A5 A4 A3

Current eBay listing
A I Artificial Intelligence 6 Movie Poster Art Print Print Classic Rare Gallery

Current eBay listing
A.I. Artificial Intelligence Blu-ray with A3 Travel Poster new and sealed
 </article>
Endnotes
1.
Source: iea.org
Title: Energy demand from AI
Link:https://www.iea.org/reports/energy-and-ai/energy-demand-from-aI
Source snippet
Energy and AI...
2.
Source: nvidia.com
Title: GB200 NVL72
Link:https://www.nvidia.com/en-us/data-center/gb200-nvl72/
Source snippet
GB200 NVL72...
3.
Source: energyanalysis.lbl.gov
Link:https://energyanalysis.lbl.gov/publications/avoiding-waste-heat-through-ai
4.
Source: eta-publications.lbl.gov
Title: ETA Publications Energy Analysis & Environmental Impacts Division
Link:https://eta-publications.lbl.gov/sites/default/files/2024-12/lbnl-2024-united-states-data-center-energy-usage-report.pdf
Source snippet
December 22, 2024...
Published: December 22, 2024
5.
Source: eta-publications.lbl.gov
Title: lbnl 2024 united states data center energy usage report
Link:https://eta-publications.lbl.gov/sites/default/files/2024-12/lbnl-2024-united-states-data-center-energy-usage-report.pdf?stream=top
Source snippet
LBL ETA PublicationsLBNL-2001637December 21, 2024...
Published: December 21, 2024
6.
Source: sciencedirect.com
Link:https://www.sciencedirect.com/science/article/pii/S0921344922000428
7.
Source: microsoft.com
Link:https://www.microsoft.com/en-us/microsoft-cloud/blog/2024/12/09/sustainable-by-design-next-generation-datacenters-consume-zero-water-for-cooling/
Source snippet
The Microsoft Cloud BlogSustainable by design: Next-generation datacenters consume zero water for coolingDecember 9, 2024...
Published: December 9, 2024
8.
Source: doi.org
Link:https://doi.org/10.1145/3744255.3811726
Source snippet
Balancing Bits and Drops: Stress-Adjusted Water Management for Data Centers | Proceedings of the 17th ACM International Conference on...
9.
Source: datacenter.uptimeinstitute.com
Link:https://datacenter.uptimeinstitute.com/rs/711-RIA-145/images/2025.Annual.Survey.Report.pdf?version=0
Source snippet
KEYNOTE REPORT — Uptime Institute Global Data Center Survey 2025...
10.
Source: iea.org
Title: energy and ai
Link:https://www.iea.org/reports/energy-and-ai
Source snippet
April 10, 2025...
Published: April 10, 2025
11.
Source: eta.lbl.gov
Link:https://eta.lbl.gov/publications/water-use-data-center-workloads
Source snippet
Energy Technologies AreaThe water use of data center workloads: A review and assessment of key determinantsJune 1, 2025...
Published: June 1, 2025
12.
Source: sciencedirect.com
Link:https://www.sciencedirect.com/science/article/pii/S1359431125013948
Source snippet
Energy and water dynamics in data center cooling: Insights from a modeling study in hot-arid climatesOctober 1, 2025...
Published: October 1, 2025
13.
Source: sciencedirect.com
Link:https://www.sciencedirect.com/science/article/pii/S0043135426014223
Source snippet
www.sciencedirect.comSystem-scale design and analysis of desalination systems for meeting water needs of data centers - ScienceDirectJanu...
14.
Source: sciencedirect.com
Link:https://www.sciencedirect.com/science/article/abs/pii/S0959652626017427
Source snippet
the burden shifting of data center cooling: System-level water-energy-carbon optimization for urban infrastructure - ScienceDirectSeptemb...
15.
Source: bies.lbl.gov
Title: united states data center energy 2025
Link:https://bies.lbl.gov/publications/united-states-data-center-energy-2025
Source snippet
United States Data Center Energy Usage Report: 2025 Update | Building & Industrial Energy Systems DivisionJune 1, 2026...
Published: June 1, 2026
16.
Source: iea.org
Link:https://www.iea.org/news/data-centre-electricity-use-surged-in-2025-even-with-tightening-bottlenecks-driving-a-scramble-for-solutions?__cf_chl_f_tk=mPlSI9KgDo0inioCRhuh6kU7U80qA.4CGq1WWVhvZcU-1783084545-1.0.1.1-072zjVfFsXXPnHR.edts3ccVzFC5OHDol3NSdHt3s8Y
Source snippet
centre electricity use surged in 2025, even with tightening bottlenecks driving a scramble for solutions - News - IEAApril 16, 2026...
Published: April 16, 2026
17.
Source: doi.org
Link:https://doi.org/10.1115/IPACK2025-169095
Source snippet
Impact of Data Center Facility Water System Design on PUE and TCO | InterPACK | ASME Digital CollectionDecember 23, 2025...
Published: December 23, 2025
18.
Source: doi.org
Title: Data Centers and Water: Challenges and Solutions for Sustainable Cooling
Link:https://doi.org/10.1002/awwa.2504
Source snippet
Khatib - 2025 - Journal AWWA - Wiley Online LibrarySeptember 11, 2025...
Published: September 11, 2025
19.
Source: blog.google
Title: environmental report 2025
Link:https://blog.google/company-news/outreach-and-initiatives/sustainability/environmental-report-2025/
Source snippet
Read Google’s 2025 Environmental ReportJune 27, 2025...
Published: June 27, 2025
20.
Source: united4efficiency.org
Title: Water usage effectiveness (WUE)
Link:https://united4efficiency.org/wp-content/uploads/2025/02/2025-U4E-Sustainable-Procurement-for-Data-Centers-and-Servers_Final.pdf
Source snippet
June 11, 2025...
Published: June 11, 2025
21.
Source: doi.org
Link:https://doi.org/10.1016/j.egyr.2025.02.013
Source snippet
ScienceDirectJune 1, 2025...
Published: June 1, 2025
22.
Source: build-up.ec.europa.eu
Link:https://build-up.ec.europa.eu/system/files/2025-04/PChtNmAZVk_11_04_2025_145800.pdf
Source snippet
Energy and AIApril 11, 2025...
Published: April 11, 2025
23.
Source: eta-publications.lbl.gov
Title: 2024 lbnl data center energy usage report
Link:https://eta-publications.lbl.gov/publications/2024-lbnl-data-center-energy-usage-report
Source snippet
2024 United States Data Center Energy Usage Report | LBL ETA PublicationsDecember 19, 2024...
Published: December 19, 2024
24.
Source: eta-publications.lbl.gov
Title: 2024 lbnl data center energy usage report
Link:https://eta-publications.lbl.gov/publications/2024-lbnl-data-center-energy-usage-report?trk=article-ssr-frontend-pulse_little-text-block
Source snippet
2024 United States Data Center Energy Usage Report | LBL ETA PublicationsDecember 19, 2024...
Published: December 19, 2024
25.
Source: bies.lbl.gov
Title: 2024 lbnl data center energy usage report
Link:https://bies.lbl.gov/publications/2024-lbnl-data-center-energy-usage-report
Source snippet
2024 United States Data Center Energy Usage Report | Building & Industrial Energy Systems DivisionDecember 19, 2024...
Published: December 19, 2024
26.
Source: developer.nvidia.com
Link:https://developer.nvidia.com/blog/nvidia-gb200-nvl72-delivers-trillion-parameter-llm-training-and-real-time-inference/?ncid=no-ncid
Source snippet
NVIDIA GB200 NVL72 Delivers Trillion-Parameter LLM Training and Real-Time Inference | NVIDIA Technical BlogMarch 18, 2024...
Published: March 18, 2024
27.
Source: developer.nvidia.com
Link:https://developer.nvidia.com/blog/nvidia-gb200-nvl72-delivers-trillion-parameter-llm-training-and-real-time-inference
Source snippet
NVIDIA GB200 NVL72 Delivers Trillion-Parameter LLM Training and Real-Time Inference | NVIDIA Technical BlogMarch 18, 2024...
Published: March 18, 2024
28.
Source: doi.org
Link:https://doi.org/10.71468/P1WC7Q
Source snippet
2024 United States Data Center Energy Usage ReportJanuary 1, 2024...
Published: January 1, 2024
29.
Source: sustainability.google
Title: www.sustainability.google Sustainability Reports & Case Studies
Link:https://www.sustainability.google/google-2025-environmental-report/
Source snippet
Reports & Case Studies - Google Sustainability...
30.
Source: uptimeinstitute.com
Title: uptime institute global data center survey results 2025
Link:https://uptimeinstitute.com/resources/research-and-reports/uptime-institute-global-data-center-survey-results-2025
Source snippet
Uptime Institute...
31.
Source: connect.uptimeinstitute.com
Title: uptime institute global data center survey results 2025
Link:https://connect.uptimeinstitute.com/resources/research-and-reports/uptime-institute-global-data-center-survey-results-2025
Source snippet
Uptime Institute...
Additional References
32.
Source: mdpi.com
Link:https://www.mdpi.com/2311-5521/11/8/201
Source snippet
Review of Thermal Management in Modern Data Centres: Water Usage Effectiveness and Heat Transfer CoefficientsAugust 14, 2026...
Published: August 14, 2026
33.
Source: scribd.com
Title: Lbnl 2024 United States Data Center Energy Usage Report
Link:https://www.scribd.com/document/864347886/Lbnl-2024-United-States-Data-Center-Energy-Usage-Report
Source snippet
www.scribd.com2024 US Data Center Energy Report | PDF | Data Center | Central Processing UnitDecember 1, 2024...
Published: December 1, 2024
34.
Source: awwa.onlinelibrary.wiley.com
Title: Data Centers and Water: Challenges and Solutions for Sustainable Cooling
Link:https://awwa.onlinelibrary.wiley.com/doi/10.1002/awwa.2504
Source snippet
Khatib - 2025 - Journal AWWA - Wiley Online LibrarySeptember 11, 2025...
Published: September 11, 2025
35.
Source: climate.mit.edu
Link:https://climate.mit.edu/sites/default/files/2025-02/lbnl-2024-united-states-data-center-energy-usage-report.pdf
Source snippet
nd technological base.December 21, 2024...
Published: December 21, 2024
36.
Source: gage.academy
Title: AIA 2026 0031 uptime institute pue 1 54
Link:https://www.gage.academy/tools/ai-infrastructure-atlas/records/AIA-2026-0031-uptime-institute-pue
Source snippet
efficiency has not moved: a weighted average PUE of | GAGESeptember 15, 2026...
Published: September 15, 2026
37.
Source: statista.com
Title: data center average annual pue worldwide
Link:https://www.statista.com/statistics/1229367/data-center-average-annual-pue-worldwide/
Source snippet
center average annual PUE worldwide 2025| StatistaJuly 28, 2025...
Published: July 28, 2025
38.
Source: fliphtml5.com
Title: google 2025 environmental report
Link:https://fliphtml5.com/gsjoh/google-2025-environmental-report/111/
Source snippet
google-2025-environmental-report (Page 111) - Flipbook by Haily | FlipHTML5...
39.
Source: discovery.ucl.ac.uk
Link:https://discovery.ucl.ac.uk/id/eprint/10230963/
40.
Source: youtube.com
Link:https://www.youtube.com/watch?v=1fneo2gHJAY
41.
Source: youtube.com
Link:https://www.youtube.com/watch?v=ckoi0RTEgcY